"Clear visualisation has helped us spot performance issues before they became problems. It’s a game-changer for our team."
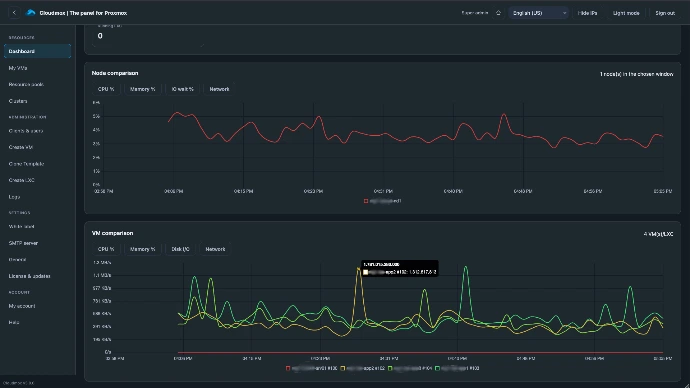
Gain deeper understanding with better graphs
Quickly identify server or VM issues by visualising load and comparing trends over time.
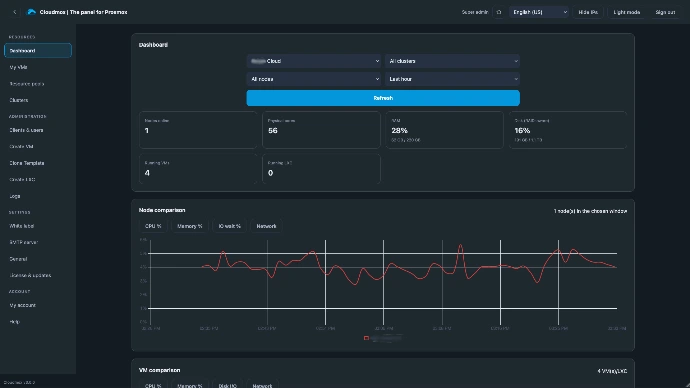
All essential metrics at a glance
Easily monitor CPU, memory, and network usage for each server or VM, and compare real-time data with historical records.
Performance trends
See how resource usage changes throughout the day or week, making it easier to anticipate and resolve bottlenecks.
Historical comparisons
Review previous load patterns to understand anomalies and plan for future growth with confidence.
Custom alerts
Set specific thresholds and get notified instantly when something needs your attention.

Faster
Support
Find problems quickly
More control
See what is happening before things fail
Satisfied
Customers
Less downtime and faster answers
Less
Infra
No need to buy more infra if it isn't used